
Important update 11 November 8:45 PM The missing votes appear to have been a data input error. The totals at the end of the early data I was given were correct. It was only the one time point that was in error. The time step where Trump goes down was due to missing data at that time: the old file I was given at the time stamp has data missing for the totals. The totals before and after are the same in the corrected data. Meaning the first curiosity has been solved: simple data error entry, which only affected the one time point. Here is the PA web site for data. Here is the corrected version of the data I was given (Excel file).
A brief note. I’ve been asked to examine the Pennsylvania votes. That work is ongoing. Update See below for a serious critique of Benford’s law.
I’m showing here (with permission) the one analysis I found most curious.
This is official county-level timed voting data that started at 2020-11-04 11:00:00, a day after the election, to 2020-11-07 11:29:00 which is Saturday night. That is, these are all late vote counts. They start, county by county, where the vote left off on election night.
This is a picture of the running totals by the time the votes were added, summed across all counties, during those time periods. They do not start at 0, but at the totals given after election night.
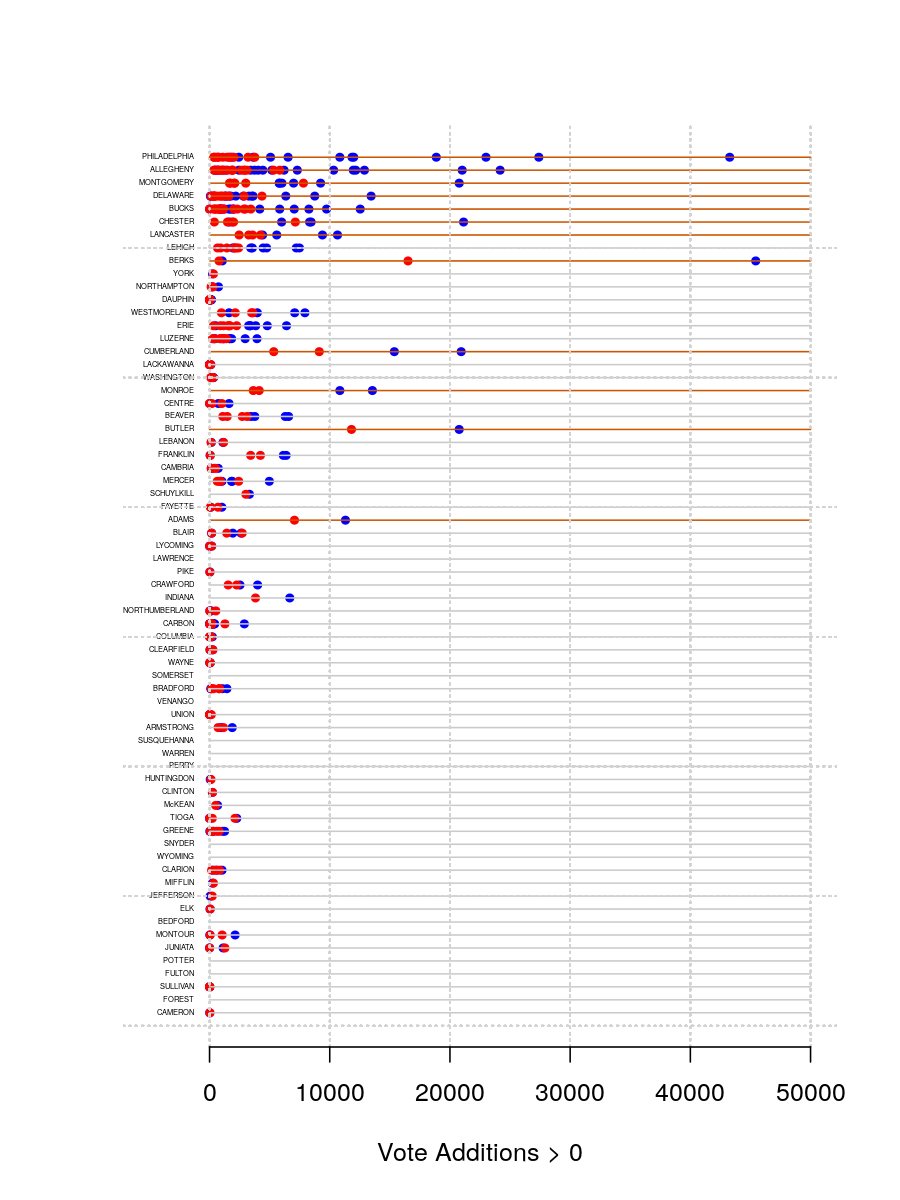
Important update This is the old figure with uncorrected data.

The early gains for Biden are from, mainly, Philadelphia, Allegheny, Montgomery, Chester and Berks counties. A simple plot (click to see: it’s large) shows the size of vote additions for both candidates, when new vote totals (greater than 0) were added by county (and not all counties added votes after election day).
Important Update All goes well for Trump until 2020-11-04 21:15:00 when he loses just under 10,000 votes, but curiously from three different counties simultaneously: -1,063 Allegheny; -2,972 Bucks; -7,135 Chester. Biden never lost any votes (at least, in this late voting).
Important Update This has been solved. Missing data at the one time point. Since the totals at all other points match, this curiosity does not appear to have been deliberate, and is just a common result of looking at early data, which can be messy.
Here is the figure with the corrected data:

Understand that this does not mean the decreases happened at this time, but that they were recorded in the official data as happening at that time. And the same is true for our next observation.
Biden’s next curiosity was the big increase of 27,396 votes at 2020-11-06 08:53:00 over one consecutive reporting period. This bump is just like the blue-red F-memes you have seen: this only seems more spread out because of the finer time scale used.
These two curiosities account for a 37,263 vote swing for Biden. Biden’s total, as of the end of this data, was 3,344,528, and Trump’s 3,310,326. Biden therefore “won”, in this dataset anyway, by 34,202 votes.
Important Update The late Biden addition is still there and real.
There is more to come. Stick around.
Update Benford’s law is only useful in uncovering multiple and on-going instances of cheating. As in somebody consistently cooking financial books. As I showed above, assuming the curiosities are cheats, it only took two instances to tip the balance. Benford’s law will never pick this up: never.
I’m skeptical of what I’m seeing in other analyses, because if somebody turns something up with Benford, it implies that many, many vote totals were tampered with, which increases the possibilities of getting caught. And you don’t need to tamper with many. Only a few.
To support this site and its wholly independent host using credit card or PayPal (in any amount) click here
Discover more from William M. Briggs
Subscribe to get the latest posts sent to your email.

It means they cheated, they announced they were going to cheat this way and no one gave a damn. So let it go. Go back to Aquinas, as boring as he is.
Oh, the election is the final test of if reality is dead and buried. If the Turnip in the Basement takes office, reality is officially dead. Only the stupidiest of stupid could believe the outcome of this election is anything but fabricated (and yes, the Left told you it would be and Biden WOULD win). So, if the Turnip takes office, declare reality dead and learn to live in hell on earth. (See: Venezuela, North Korea)
What would be an official explanation for the vote decreases?
After Trump was elected 50% of American voters were convinced that Russia helped him to steal the election.
Now that Biden appears to have been elected 50% of American voters think the Democrats stole the election.
The good news for all patriotic Americans is that we no longer have to outsource election fraud.
We can do it domestically.
Those curiosities seem like little ripple waves on a lake. I wonder how much shenanigans it takes to get Biden to with a few 10 thousands of votes of winning.
Revolver.news linked to you article. Nice.
I hope your client benefits from your analysis.
Do these numbers include the ballots that were ordered to be segregated and not counted?
Like the Kennedy family, the Biden family didn’t want to pay for a landslide.
The vote shift of Trump, if true, is interesting. It could be clerical error, but certainly needs investigation. Biden’s increase could be the incoming votes. We all know that Democrats voted in large number by mail-in. So, the mail-in votes are being counted. Many of you are seeing patterns where none exist.
I heard Benford’s law was used in I think Iraq election to find fraud.
It was Iran not Iraq
A recount can be called per county if three voters file in court of commons pleas by Nov 12.
Good work! Thoughts & extensions.
– Drill down to county at the critical times.
– The extreme values in dot plot …. what are those dumps and how domthey break? Both blue and red extremes, not just blue extremes.
– Are there dumps of military ballots and how do we know?
– Are there points in time that go negative additions (net < 0), or something suggestive of correction? i.e., an error corrected.
– Are there points in time where the total does not change (net 0) but the votes at top of ticket change? Does down ballot change also?
I am gonna bet these are on your plate, and thoughts on others.
Hope it helps, not adds to the noise. Hope you have the data you need. Hope you write up your journey, technology, tools & data when all over.
TRUMP TRAP IS IN PLAY
https://open.lbry.com/@TRUMP2020:2?r=F3xNM9P3QqUgjSbtNxYdHGneGqaRAx6e
TRUMP TRAP IS IN PLAY
https://open.lbry.com/@TRUMP2020:2?r=F3xNM9P3QqUgjSbtNxYdHGneGqaRAx6e
Where could I get ticker like data like this? I tried googling a few different ways and couldn’t find anything.
I was interested in looking up if there really were traunches of like 27k votes for Biden but zero for Trump, and if so was there at least a corresponding other tranche of like 2-5K for Trump but 0 for biden? The 27k tranche bothered me and the Debunkerino Enforcement Squad ticketed me with “sometimes counties were just updating one candidate at a time, so that’s why Trump got zero, his would be reported later.”
Someone please correct my understanding. Only a couple instances of fraud would not cause a dataset to violate benford’s law. And yet benford’s law is violated.
It seems the first anomaly is corrected in the next cycle with a spike that appears to have brought the curve back into its original shape.
Everything is so tainted we will never know what the real vote numbers were.
Each and every state requires a full re canvassing and a full hand recount with mass supervision of every ballot. The Trump admin and every one of these legislatures needs to push for this ASAP. This republic is worth waiting a couple weeks to get it right. Let’s hear Joe Biden say he’s NOT for verification and getting it right…..
LOL – two “curiosities”. How about blatant ballot rigging/electronic tabulation manipulation?
Does anyone know where I may find the data to make these graphs, or the graphs for all counties?
Last night PBS preempted programming to display propaganda that “of course” biden won. I did not watch it, but did turn back to it repeatedly to see if they had returned to regular programming. Each time I turned to the channel, there was some smarmy scripted sanitized face of someone I had never seen before proving Biden won and the tone was a giveaway. it sounded JUST LIKE someone trying to justify global warming based on a record high temp. “you see!” Again, I did not watch, but each time the tone and info was the same, all highlighting the obvious biden wins.
I don’t care for either, but this election fails the international standards for fair election.
Pingback: Two Statistical Curiosities That Allowed Biden To Pull Ahead In PA: Please Share | Reaction Times
On the other hand, if the software is also being used to shift votes, then multiple small adjustments across many wards is better than one or two massive ones. This is what Benford’s Law would show.
The Russians didn’t help Trump and that was proven. Clear evidence the Dems cheated. Flush out your headgear. Ends justify the means. Recount all the votes, every state. Get it right regardless of who wins. We are better than this.
Hello,
I’d train a model based on the last past 10 elections. In my opinion, a simple SVM would suffice coupled with a simple feature extraction set made from discrete entropy, gini, Hjorth an Barlow to cover different spaces; then I’d try to fit this new input to it; hence, the nature of those oddities could be asserted or not.
Both this article and the majority of the comments make me weep for the intellectual future of our country. First, the author presents this as a serious analysis yet provides no data sources and readers simply accepted as true without making an effort to confirm. Second, the author leads the reader to assume fraud is the explanation for both anomalies noted. As one reader noticed, the first anomaly is immediately corrected, with the slope of the curve bouncing right back. This would more likely represent a corrected error than fraud. The same reader also noted that the second anomaly of the late surge of Biden votes would be more likely due to more Biden supporters voting by mail, just as was expected. So again, not fraud. Only one reader actually analyzed the data. The rest let the author use their own confirmation bias to show suspicions. And as a result now we have people on sites like Zero Hedge talking openly about armed civil war. Question: what do such agitators have to gain by putting American citizens against one another and who do such agitators really represent?
…and you can easily show, by looking at the oddly consistent discrepancies between exit polls & declared results, which key counties in both 2016 & 2020 had rigged machines (and since it involves just a couple of manufacturers not really all that hard to track, especially if you bother to look for the Putin connections). Biden’s victory this year was of course by waaaaay more than has been recorded.
Why was the countng stopped on election night in 6 states
Pingback: #ElectionCoup Updates « Mark America
I got this reference from Jo Nova’s site in one of the comments: https://www.youtube.com/watch?v=ficae6x1Q5A&feature=emb_logo
It seems credible on its face and would explain how many small computer changes could happen invoking the failure of Benfords law.
This is aggregated data at the state level. How are you certain that the Benford analysis isn’t applicable to the precinct level data? While one or two counties may not validate Benford but it’s worth a look at the precincts that aggregate to the county level.
Interesting that the subtraction of 9K and the addition of 27K is about 36K net gain for Biden. This is about 3% of the total of 3.5M votes. The report from Gen. McInerney indicated that Hammer and Scorecard software developed by the intelligence community to change vote totals was designed to limit the number of votes it added or subtracted to no more than 3% to avoid obvious detection. Is this just a coincidence or more evidence that it may have been deployed in PA?
eat a dick, “Dilan”
Democrat’s New National Motto Memo
Attention all Democrats: in order to perpetuate our Liberal Lust
Our new national motto is “In Fraud We Trust”
It may sound to some immoral and unjust
But it’s a means to an end so “In Fraud We Trust”
We can continue to fundraise, campaign if we must
Or just stay in the basement, because “In Fraud We Trust”
The homeless can be bribed, the immobile can be bused
But in mail-in ballots and “In Fraud We Trust”
And if by the vote count you are left in the dust
Stop reporting, start searching for “In Fraud We Trust”
The vote count we can always manage to adjust
Be patient and remember, “In Fraud We Trust”
The conservative majority will finally be crushed
Replaced by fake ballots, for “In Fraud We Trust”
Our Fake News friends always cover for us
You see our motto is theirs “In Fraud We Trust”
And we celebrate democracy, though we view it with disgust
No longer can it stop us because “In Fraud We Trust”
Let Freedom and Fairness and Faith be cussed
That’s for the weak-minded! “In Fraud WE Trust”
Phillip Kelly 11-5-20
first there was JFK and Cook County, then LBJ and South Texas, now there is biden and the election nite vote scam
We all know why the election was stopped in six states on election night. The liberals and media just think we are dumb asses. What a fraud.
Benford’s law has high sensitivity but lower specificity. This means that is sensitive to detecting fraud but there are also non-fraud systemic factors that can trigger false positives. If it doesn’t detect any anomalies its a good indication that the data has not been manipulated with additions or subtractions. When it does find problems it just means the collection of the data must be evaluated to eliminate possible systemic factors. If these can be excluded it is likely the data is fraudulent.
Factors that can trigger false positives when trying to detect voting machine fraud are things like the way voting machines may be placed in a polling place where they are disproportionately used because they are preferred by voters for some reason. With aggregated precinct level data these effects should be smoothed out.
There are assessments that worry me, especially when the “intellectual future” is called. First, there might be a correlation between mail-voters. However, at this point, there is no data evidence to yet back up it; so it’s not facts but merely assumptions and repeating a narrative. Correlations are correlations not arithmetic operations; keep that in mind. Second, “the first anomaly is immediately corrected, with the slope of the curve bouncing right back.” from a mathematical point of view, I don’t know what it means; there are time series; showing events happening at T; either, there is linearity or not, in my opinion, should not be so chaotic and noisy, we don’t look at a seismograph output or a biological signal, just an opinion. Once again, to verify present patterns look into the past then compute a estimated error function to back up such claims or invalidate them; simple. I am no partisan in this matter, meanwhile, people still have the right to ask questions. If questioning data is now a call for civil war? or division? or being an agitator? we are far from any basic intellectual ground here; your pseudo-correlation assertions are very disruptive and people should be very worried about that kind of mindset.
Just a correction to my post about the 36K vote spikes to Biden. This would be about 1% not 3% of the 3.5M votes. 3% was actually the upper limit that Scorecard could change without getting detected.
“Update Benford’s law is only useful in uncovering multiple and on-going instances of cheating. ”
There are multiple and on-going instances which is evidenced by the already run analysis of the numbers. Yes, they could have done in a couple changes, but they did not do it that way. They cheated across the board.
Why not look at more granular data from precincts? Also look at precinct data in terms of registered voters vs tabulated votes vs current eligible voters per precinct?
This isn’t hard.
Also, call for everyone to cure their vote. If fabricated votes were tabulated, fabricated people can’t respond…use big tech’s platform to have people cure their ballot if we think there was widespread election fraud. This isn’t a do-over per se, it’s a feedback loop that is sorely missing in the process. I can’t go to my state election authority, in the final official database, and get any feedback on even whether I voted, much less who for.
This looks to be extremely important work. I have one question.
The total number of votes is allegedly reduced by the Hammer/Scorecard software. That software has been claimed to reduce a total by at most 3%. So, for each of the three reductions discussed herein (1063 Allegheny, 2972 Bucks, 7135 Chester), what was the reduction as a percentage of the total at the time?
I do not understand the graphs very well, but I do know that God is in charge, and that that which He allows has meaning and purpose for the salvation of many. Trust Him in this and in all things.
Pray for an honest outcome. Pray for those who have participated, and are participating, in any fraudulent actions, if such are going on regarding this election.
We all can always benefit from prayer for God’s will to be done in our lives.
God bless, C-Marie
This election requires an audit of all counties and states…too many hinky anomalies. How do we request this?
Maybe there is a reason for Trump’s loss that does not require cheating as an explanation
https://www.unz.com/akarlin/maga-cope/
Could you please post the raw data you used in this analysis? I’ve not been able to find it anywhere, but it is curious and I’d like to dig into it myself too!
Important technical consideration, sourced to state documents.
FL used an early version of the software:
fewer POTUS-only votes, no odd pauses.
Most swing states (including in PA at least Philadelphia, Alleghany, and Erie; maybe all) used a new version (5.5):
updated just before or during the election.
The new version was not reviewed for security; in fact PA failed one version (5.5), before apparently accepting a patch to it, without review.
In AZ only Maricopa used the new version.
https://twitter.com/ckevincrow/status/1325466499180613632?s=20
@Amateur Brain Surgeon, it’s very not the topic and the discussion of the current study. And anyhow according to your source, if “small scale fraud” happens (however I agree with large scale statement, it would require to bribe a lot of people and synchronization) it should be enough to invalidate any election then starting over with proper controls. There is no half-way or small-okish cheating. If there are; it is very not acceptable not matter the scale and/or the political color involved. @Phil yes you are right, raw dataset sources; + maybe the ones from the FEC from the past elections /per counties/ would be a must have; if they could github that instead of plots…
Do I need to say more
https://confirmedsource.com/news/dhs-sting-operation-uses-watermarked-ballot-paper-to-validate-ballots-game-over/
Neither the DHS nor the CISA design or audit election ballots. This is the responsibility of each state. The DHS has not announced or conducted a sting operation using watermarks on ballots to deter election interference.
Read this … President Trump’s remarks:
https://www.whitehouse.gov/briefings-statements/remarks-president-trump-election/
God bless, C-Marie
Just Facts’ analytical take on quantifying only one fraudulent election tactic: illegal immigrant voters:
https://www.justfactsdaily.com/quantifying-illegal-votes-cast-by-non-citizens-in-the-battleground-states-of-the-2020-presidential-election
…confirmation bias to show suspicions. And as a result now we have people on sites like Zero Hedge talking openly about armed civil war. Question: what do such agitators have to gain by putting American citizens against one another and who do such agitators really represent?
…your pseudo-correlation assertions are very disruptive and people should be very worried about that kind of mindset.
Excuse me? Questioning the election results is “very disruptive” and is “leading to armed civil war”?
What about four years of constant agitation against Trump and his supporters, daily insults towards both, the Russia Hoax and attempted coup by the Deep State, the phony Impeachment and all the associated lies and slanders, shuttering schools and churches while encouraging and enabling armed riots, looting, and arson by Marxist militias, rigged voted counts, censoring and cancelling their opposition, threats of “re-education” camps and shunning Republicans from jobs, offices, and “polite” society, and numerous other provocations emanating from the Hard Core Left and their corrupt media minders?
If any faction is and has been pitting citizens, dividing the country, and provoking civil war, it is the Democrat Party, for years.
Now whiner Leftists are worried that they might get their wish, that they might have pushed too hard, that a push back is coming from the tens of millions of people they have targeted with vile punishments and sanctions for daring to oppose them.
You reap what you sow. What goes around comes around. Payback, my dear Lefty Loonies, is a b*tch.
the thing is PA was instructed by the Supreme court to set aside all mail in ballots received after election they’re not supposed to be counted.
If you corruptly accuse (Russian hosx)
corruptly bear gals witness (impeachment) what is the stretch in believing corruption vote coveting
(election) by the party that has sown such discord?
Can you imagine what accomplishments might have been achieved in 4 years with a United country?
“ if somebody turns something up with Benford, it implies that many, many vote totals were tampered with”
Yes.
FU Bedford law.
It certified 2019 indian EVM voting fraud election as legit.
2019 india election was biggest fraud comitted by modi govt.
I have made the same critique of the use of Benford’s a couple of times today, but the problem with changing only a few entries has its own issues- they get noticed more easily. I am not sure how smart these people really are.
Pingback: 2020 Election, Possible Cheating & Trump’s Legal Fight | LEADING MALAYSIAN NEOCON
Oh, and those saying the curve bounced back- you don’t know from where the bounce back came. The decreases do have to be explained. It could be simply an error that was immediately corrected, it could be the correction of an earlier error, or it could be an uncorrected error altogether.
It needs an explanation, and it needs one because, in particular, it occurred a major inflection point in that curve.
Here is a video (CNN) from election night, where in Pennsylvania 20K votes switch from Trump to Biden.
Start of video PA total votes are:
Trump 1,690,589
Biden 1,252,537
At the end of the video the totals on the screen are for PA are:
Trump 1,670,631. -19,958 votes
Biden 1,272,495. +19,958
https://twitter.com/bcmarjac/status/1325626677179928577?s=20
On the Benford Analysis- one thing- it is getting misapplied in certain instances on the 1st digit analysis. You have to be careful how it is applied to the 1st digit- just to give an example, if you apply to certain cities indiscriminately, you might miss the fact that all precincts might just randomly have a tight distribution of results that are smack dab in the middle of a magnitude range such as 300-600. It could easily be that one candidate gets 60-80% of the vote in precinct after precinct, and that total regularly falls in a range that doesn’t include 100s or 1000s. In those cases, you have to apply the law to the subsequent digits.
I believe that PA (where I live) vote totals are due to fraud.
But, amazingly the fraud may not have occurred in Philadelphia County. Or at least it will be hard to find from the raw numbers. I got 2016 data from wikipedia. I got 2020 data from the county website, which shows that counting isn’t done yet. So, I assigned all uncounted votes to Biden. The results are that Trump picked up a net of 27,561 votes compared to 2016. There were only 2,136 (0.3%) more ballots cast in 2020 compared to 2016, turnout actually decreased. Joe Biden actually got 8,586 less votes than Hillary Clinton in Philadelphia county.
For the state as a whole, voter registration increased by 368,394 (4.22%), Dem registrations stayed about the same, Rep increased by over 240,000, and the rest were Other.
First look election analysis, 634,270 (10.37%) more votes were cast; turnout increased from 70.11 to 74.24.
Trump’s vote total increased by 344,106 (11.58%), but Biden vote total was 430,937 (14.73%) more than Clinton. 2020/2016 D/R flip in total votes was 86,831.
The Green party was not on the presidental ballot in 2020 (The Dems sued to remove them) and the Libertarians vote was cut in half. G+L decrease was 119,201.
There is no state wide data on ballots that were blank for President (my county has reported blank ballots and Blank 2020/Green 2016 is over 25%) so the simple argument of Biden won because he got the Green/Libertarian voters from 2016 is also invalid because of the 240,000 increase in Republican registrations. And Trump vote as a percent of Repub_Reg increased in 2020.
The 2020 county by county vote data is not consolidated, but is on each county’s website. So, I will try to gather and analyze for an update later today.
Benford’s law issue seems to be more a product of the local cities rather than interlocked with the huge spikes, I would expect it would be seen in most near any elections from these cities, and in similar amounts. Chicago, Milwaukee, Detroit, Philadelphia, Pittsburgh, etc, they probably move 30-40k votes in each region every election, because it’s just how things work.
You need to look at all the counties where Biden far outperformed downballot candidates and held late vote-tallying to swing the key states. Not just PA. The same anomalies repeated in key city after key city in only the close states.
Then compare them with counties that completed counting on time.
The latter all conform to Benford.
None of the late-counting cities that went to Biden did.
That is statistically significant. It points to a highly-coordinated, multi-state effort to add enough votes after all the polls were closed to tip the balance.
The massive mail-in effort was designed specifically to facilitate large scale fraud. The court cases to get the extensions for ballots postmarked by the 3rd was a delay tactic to allow the necessary extra votes to be calculated and inserted AFTER the rest of the country had voted.
Why do you think legally authorized observers were denied entry or kept at distances where they could see nothing?
Seriously, a candidate who was rarely seen, called early lids for the day for the past month+ and whose rallies were sparsely attended pulled the most votes of all time? Even more than Obama? C’mon man.
Dear M. ABS forgot that Benford’s law was addressed by the author in the comments section
https://www.cambridge.org/core/journals/political-analysis/article/benfords-law-and-the-detection-of-election-fraud/3B1D64E822371C461AF3C61CE91AAF6D
Trump had fewer white males voting for him than last time.
Maybe they weren’t all jazzed up about Jared Kusher’s “Prison Reform program” or Trump naming Jerusalem the Capital of Israel or Ivanka’s outreach to sodomites.
Trump promised he’d be the champion of working class folks and he delivers this load of liberal crap?
Good riddance clown.
Mathman, I need to speak with you please.
To Mathman’s point, the fraud analysis needs to be focused across two sets of data: 1 set is swing state, swing districts/precincts and a comparative set in non-swing states, non-swing precincts. The analysis should look at ballots mailed or voted after 10/30, assuming ballots received after 10/30 are sequestered from earlier ballots. Compare the frequency distributions of Presidential votes and the rest of the down ballot distributions between R/D. The pattern will emerge.
I would really like to see how you collected the data showing these issues. The plots are only as good as the data source, and I would like to see this data to independently verify it.
Has this information of widespread fraud been given to the Trump campaign or Rudy? We all have to know what really happened in this election in order to have faith in our elections in the future.
Has this information of widespread fraud been given to the Trump campaign or Rudy? We all have to know what really happened in this election in order to have faith in our elections in the future.
@Amateur Brain Surgeon, this is not the right place for you. Benford’s Law and its diverse applications is very discussed especially in the realm of financial fraud detections and network malicious traffic coupled with ML. You are making a fool of yourself quoting a single paper which is a contextual discussion; not a political tribune. Once again, you are off topic with your `assumptions`. we don’t, we analyze data. It looks like there are some people which absolutely don’t want this matter to be analyzed and `modelized` properly (preferring to be noisy; proffering `what if` enormities only living in their minds) using here what ML offers best: i.e automated statistics and blind pattern detections; let’s crunch those data for the past 60 years. simple. FEC must publicly release their raw datasets since ever.
101 Cyber Hacking. Don’t you hear it every day on Media? Lifelock etc? Go to YouTube-search L Todd Wood interview with Russell Ramsland from November 5th. It is the best tutorial on how HAMMER & Scorecard works. At the end of the interview is the Bombshell! Congratulations! PRESIDENT TRUMP on your second term!?????
Folks, we are all missing the point here. Watch the Netflix Documentary, ” Social Dilemma” TODAY. It spells out, by implication, exactly how the manipulation of the 2020 “fraud” of the Presidential Campaign has taken place. We need to capture the data sets of all social media ads (in all forms) that were sent/ presented to those R/D voters in the swing states for the last 10 days of the election. The pattern will emerge.
@jjdbm77, I just watched “Social Dilemma” to know; that’s lame those people aren’t able to answer to what is the obvious simple problem; living your life into virtuality where everything is fake and just propaganda; there is no disinformation; there is an overflow of inaccurate pieces; mind, expression, logos is based on thought processes , self-reflections and most of differentials; our brain is a well balanced prejudice machinery; instant message is the opposite of any natural mind and reasoning process as it’s only based on a pavlovian emotional reflexes (the lowest functionalities). The “social media” industry and certainly not the “tech industry” (it tells a lot about the psychical environment those few people live in; not reality) is the sorcerer’s apprentice, there is no social in destruction of logos. However, it departs from the issue here; sci-fi psycho-babbling are amusing to a certain point; if the masses are the first victims of such diversion; few people remain pragmatic; and that’s enough. Should we be back to the current topic?
CORRECT! – Benford’s Law implies many, many people cheated and guess what? Many many people did…just like do with everything outside of voting and elections.
WHY VOTE? – Why trust any Blue Democratic City with any Voter Integrity when they can’t do anything right?
https://www.foundingfathers.org/Papers/Politics/WhyVote_WhyTrustAnyBlueCityWithAnyVoterIntegrityWhenTheyCantDoAnythingRight.aspx
Pingback: TUESDAY EDITION – THE SAMIZDAT HERALD.
I analyzed Chester County’s raw data at a precinct level using Benford’s Law and a chi-square test and got an astoundingly low p-value. There were 230 precincts, and when separated out for Biden and Trump, that gives you 460 data points. I know that’s not an extremely high number, but can anyone else out there repeat?
https://pennsylvania.totalvote.com/Chester/ResultsExport.aspx?cid=03
Pingback: A Few More Odd “Glitches” In Pennsylvania: | Tai-Chi Policy
Where did you get the time series data of the vote count ? I go to country election result, but all I get is the current or final vote vote. This article would be more persuading if you can at least show the readers how you get the data.
Pingback: Statistical analysis of Philadelphia voting data
Pingback: More "Glitches" in Pennsylvania: Votes for Trump Drop IN THREE DIFFERENT COUNTIES SIMULTANEOUSLY — Almost As If It Was Coordinated | The Patriot Gazette
Pingback: “GLITCHES” PROLIFERATE: Votes for Trump Drop IN THREE DIFFERENT COUNTIES SIMULTANEOUSLY (COORDINATED) – True News Hub
Pingback: Election 2020: Fraud - Are the Claims as "Baseless" as the MSM Implies? You Decide - The Hot Mess Press
Where can I download the raw time series data? I couldn’t find it on the links provided in a previous reply.
Pingback: “WELCOME FRAUD” Kayleigh McEnany Says Democrats Committed Election Fraud Against President Trump – Niki´s Opinion Forum
Pingback: Votes for Trump Drop Simultaneously | Shift Frequency
Based on the NYT data for Philadelphia’s vote drop, the margins were significantly higher on 11/3 and 11/4 at 95% Biden. Mail ballots reported between 11/5 and 11/10 are significantly less blue at 88% Biden. Given that ballots would be randomized through the mail, one would expect that margins would not be vastly different. It may not be fire, but these anomalies need to be explained for transparency.
Historical data can be found at – https://github.com/alex/nyt-2020-election-scraper
I’m curious though. Assuming this Benford thing actually warns to take a closer look, would one possible explanation be this:
(1) There is widespread fraud committed by pro-Biden (or at least anti-Trump) D election judges etc., but
(2) the only central planning D HQ did was disabling basically all security protocols, not however directly coordinating the steal, thus
(3) distancing themselves from the actual criminal behaviour.
In other words, while they keep their hands clean in the eye of statutory law (not in the eye of natural law though) they suffer the drawback that because of the way they incited the fraudulent behaviour there is too much of it, so it becomes statistically detectable.
That seems to be a possible explanation why apparently “many, many vote totals were tampered with” instead of the “few” needed, even though this increased the chance to get caught.
Yeah, I’m sure there’s “no election fraud” in my hometown of Milwaukee. I’ve actually seen it with my own eyes. Democrat Party workers have come to our door requesting to talk to 3 people who have voted in several recent elections (all Democrats) registered to our address. None of these people lived here at the time they voted. We only have 2 legal voters actually residing here out of the 5 that are registered to this address (and we’ve owned the house for 13 years). The illegal voting seemed to have subsided with the voter ID law (party workers noted that the illegal voters hadn’t cast ballots since the law came into effect), but I can’t seem to search for voter records by address to see if they voted absentee this election.
I just checked the numbers and 84% (about 1600) of the voters in my ward cast ballots in this election. That just astounds me because I was #157 at about noon. There was no line, nor was there a line later in the day (in previous hotly contested races, the line to vote was out the door and we were in the 600s after work). The sign in binder was nearly blank as they paged through it and only 1-2 names per every 2 pages were marked as absentee (for a total of maybe 200-300 absentee ballots in my estimation). None of this is a smoking gun for fraud, but it seems very improbable to me that my ward saw that many ballots, particularly when the in-person turn out was low, as was the marked absentee total. It’s not surprising to me that the ward voted overwhelmingly for Biden because it’s typically blue because of a high union/low income population, but if there were several hundred illegal votes garnered in just one ward, that would put the state totals in question.
@Felix it’s all the point we don’t know, we just notice, you assert 1,2,3 we don’t about and no-one here ever claims to detain the Grand Truth; we have mathematical tools, we have have allegations: let’s have a look at it, that’s it, original author intent. Then conclusions about likeness or unlikeness will come at some point; it is never one-sided.
Pingback: Practical Application of Statistics & Data Analytics - DZ Sokol
@M
I’m sorry I don’t fully understand your comment directed at me.
However, you seem to have misinterpreted what I said. I don’t assert anything. What I do is constructing a hypothesis as to how what we can observe can be explained.
At no point do I assert that if this hypothesis would be sufficient to explain the data that therefore it must be true. I was asking if there is a reason to assume that the hypothesis would not provide a sufficient and satisfactory explanation of our observations.
Brigg’s final paragraph highlights that a competent fraudster who has the power to do so would avoid changing enough data to have it become detectable via Benford’s law. I merely try to find a possible explanation for this that does not involve brazen or stupid behaviour.
There may be widespread fraud intentionally induced by doing away with all security protocols and counting on enough Biden followers will think cheating in an election is preferable to allowing “Hitler” to win.
I asked if this scenario would fit the observed data. You seem to want to say it does not without proper analysis or engagement. I am not sure I read you correctly, though. Can you expand your reply?
I don’t think data entry error is a sufficient explanation for reducing votes. Typing 3 four digit numbers that incorrectly takes talent – the keys are wildly far apart, but there should be no typing – the voting machines and counting machines all have computer tabulators and those totals are moved by thumb drives. Dominion software is very vulnernable to operator errors in the transfer process – which is precisely what we are looking for – and to blindly trust they found and corrected it is foolish. If we saw this error there could be others. Reducing someone’s votes requires a faultless paper trail and/or a manual recount for the machines or precincts affected until the explanation is 100% verified.
//Meaning the first curiosity has been solved: simple data error entry//
Data entry is NOT a satisfactory explanation w/o explaining supposed point of origin of manual data entry. I doubt very much you are claiming that the numbers in the excel spreadsheet were typed out by hand, but if not then at what stage in the pipeline are all of these numbers entered by hand. It also seems if they were entered by hand then the original document could have had the track changes featured enabled, which could tell us which user at what time made the data entry mistake… What am I missing here?
All,
I do think the missing data was accidental. The data (which you can download above) has a analysis put on top of it by the party that gave it to me. I’m guessing that in doing that came a slip of the keyboard and the deletion was never noticed. Because the before and after totals are the same, it went unnoticed, I mean. It’s really my fault, because I didn’t notice it at first either. I should have been more diligent.
There is a good video discussion of Benford’s law here:
https://www.youtube.com/watch?v=etx0k1nLn78
It discusses the Chicago data, which is perhaps not the most relevant, but makes some good points.
If dems cheated why did they stuggle to keep the house and barely holding on to the Senate. You guys will believe anything. This data shows simple data entry not when the votes were counted or when people voted
DON’T OVER THINK IT… People who don’t understand how low-key Biden got more votes than charismatic Obama are missing one KEY element. The MAJORITY of American HATE TRUMP.
They hate his LIES,
his game playing,
his GOLF,
his MASSIVE GLOBAL ignorance,
his CHEATING,
his PHILANDERING,
his fake “Bibleism,” (“Two Corinthians’)
the Falwell BS,
the COVID spreading events AT THE WHITE HOUSE and at many rallies,
his emoluments BS,
his unbridled nepotism,
HIS TACKY TWEETS,
his 7-year old mentality,
his firing of anyone who slightly disagrees with him,
all his FOX News hires (from K.T. McFarland to Bill Shine to Kayleigh Mac),
his DIS of our allies (France, Canada, Merkle, etc.)
and his coziness with dictators (MBS, KJU, Erdogan, Dudarte)
his allowing Putin to put a $100k bounty on the heads of our marines in Afghanistan,
His denigration of the military across the board,
his tax cheating and bank FRAUD,
stripping of important regulations as recently as today with the spy planes over Russia).
They HATE TRUMP from top to bottom and they would have voted for a (dead) GOLDFISH over Donald J. Trump!
BIDEN’S WIN can be partially attributed to Joe Biden’s depth of knowledge and long experience in government including chair of the two most important Senatorial committees – Judiciary and Foreign Relations – etc. but the REAL reason Biden won in a virtual Landslide… is PEOPLE HATE DONALD J. TRUMP.
BIGLY… maybe even BIGGER!
Read the following for the truth of the accomplishments of the President Trump Administration!!
https://downloads.frcaction.org/EF/EF20I29.pdf
God bless, C-Marie
Pingback: Straw Puppy’s POTUS Polls: Legal blowback edition – Camestros Felapton
Pingback: Election Legal Action Update - Thoughts.com
Pingback: “??? ???? ???, ????? ?? ? ?”…?? ?? – ??????