Parts of this analysis were suggested by Allan MacRae, who kindly offered comments on the exposition of this article which greatly improved its readability. The article is incomplete, but I wanted to present the style of analysis, which I feel is important, as the method I use eliminates many common errors found in CO2/Temperature studies. Any errors are, of course, entirely my own.
It is an understatement to say that there has been a lot of attention to the relationship of temperature and CO2. Two broad hypotheses are advanced: (Hypothesis 1) As more CO2 is added to the air, through radiative effects, the temperature later rises; and (Hypothesis 2) As temperature increases, through ocean-chemical and biological effects, CO2 is later added to the atmosphere. The two hypotheses have, of course, different consequences which are so well known that I do not repeat them here. Before we begin, however, it is important to emphasize that both or even neither of these hypotheses might be true. More on this below.
The source of monthly temperature data is from The University of Alabama in Huntsville, which starts in January 1980. Temperature is available at different regions: global, Northern Hemisphere, etc. The monthly global CO2 is from NOAA ERSL.
We want to examine the CO2/temperature processes at the finest level allowed by the data, which here is monthly at the time scale, and Northern and Southern Hemisphere and the tropics at the spatial scale. The reason for doing this, and not looking at just yearly global average temperature and CO2, is that any processes that occur at times scales less than a year, or occur only or differently in specific geographic regions, would be lost to us. In particular, it is true that the CO2/temperature process within a year is different in the Northern and Southern hemispheres, because, of course, of the difference in timing of the seasons and changes in land mass. It is also not a priori clear that the CO2/temperature process is the same, even at the yearly scale, across all regions. It will turn out, however, that the difference between the regional and global processes are minimal.
The question we hope to answer is, given the limitations of these data sets, with this small number of years, and ignoring the measurement error of all involved (which might be substantial), does (Hypothesis 1) increasing CO2 now predict positive temperature change later, or does (Hypothesis 2) increasing temperatures now predict positive CO2 change later? Again, this ignores the very real possibility that both of these hypotheses are true (e.g., there is a positive feedback).
During the course of an ordinary year, both Hypotheses 1 and 2 are true at different times, and sometimes neither is true: in the Northern Hemisphere, the temperature and CO2 both increase until about May, after which CO2 falls, though temperature continues to rise. In the Southern Hemisphere, temperature falls in the early months, while CO2 rises, and so on. These well known differences are due to combinations of respiration and changes in orbital forcing.
There are, then, obvious correlations of CO2 and temperature at different monthly lags and in different geographic regions (I use the word “correlation” in its plain English meaning and not in any statistical sense). We are not specifically interested in these correlations, which are well know and expected, and whose role in long-term climate change is minimal. The existence of these correlations present us with a dilemma, however. It might be that, for either Hypothesis 1 or 2, the time at which either CO2 or temperature changes in response to changes in forcing is less than one year, but disentangling this climate forcing with the expected changes due to seasonality, is, while possible, difficult and would require dynamical modeling of some sort (in the language of time series, the seasonal and long-term signals are possibly confounded at time scales less than 1 year).
Therefore, instead of looking at intra-year correlations, we will instead look at inter-year correlations. This introduces a significant limitation: any real, non-seasonal, correlations less than 1 year (or at other non-integer yearly time points) will be lost and it will be possible that we are misled in our conclusions (in the language of time series, the “power” on these non-integer-year lags will be aliased onto the 1 year lag). What is gained by this approach, however, is that there is no chance of misinterpreting lags less than one year as being due to a process other than seasonality. However, the main purpose of this article is not to identify the exact dynamical and physical CO2/temperature relationship, nor to identify the lag that best describes it; we just want to know is Hypothesis 1 or Hypothesis 2 more likely on time scales greater than 1 year?
Most of us have seen pictures like this one, which shows the monthly CO2 for 1980-1984; also shown in the Northern Hemisphere (NH) temperature anomaly (suitably normalized to fit on the same picture).

You can immediately see the intra-year CO2 “sawtooth”. This sawtooth makes it difficult to find a functional relationship of CO2 and temperature. I do not want to model this sawtooth, because I worry that whatever model I pick will be inadequate, and I do not immediately know how to carry the uncertainty I have in the model through to the final conclusion about our Hypotheses. I also do not want to smooth the sawtooth, or perform any other mathematical operation on the observed CO2 values within a year, because that tends to inflate measures of association.
Instead, let’s look at CO2 in a different way:

This is yearly CO2 measured within each month: each of the 12 months has its own curve through time. It doesn’t really matter which is which, though the two lowest curves are from the winter months (for those in the NH). What’s going on is still obvious: CO2 is increasing year by year and the rate at which it is doing so is roughly constant regardless of which month we examine.
Looking at the data this way show that the sawtooth has effectively been eliminated, as long as we examine year-to-year changes within each month through time.
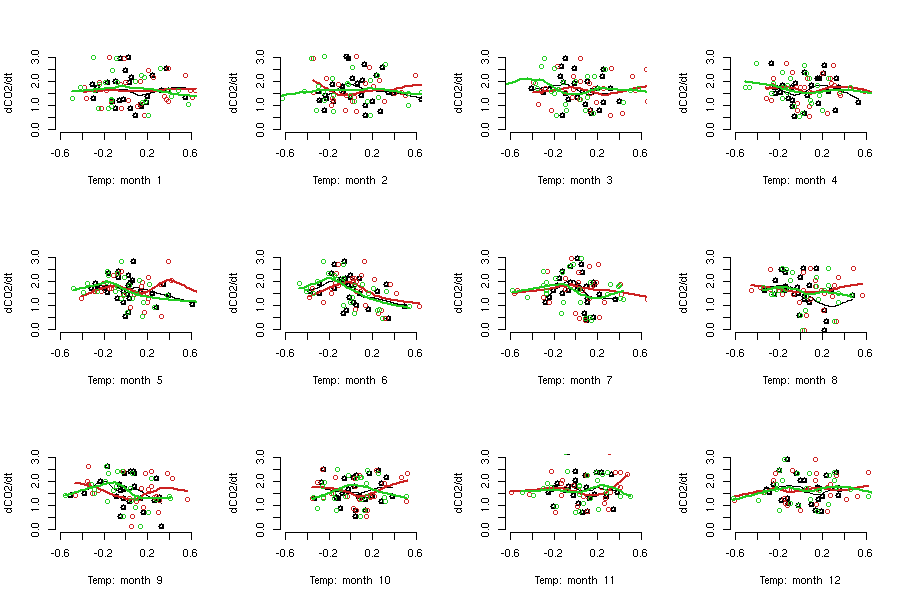
Suppose we were only interested in Decembers and in no other months. Let us plot the actual December temperature from 1980 to 2006 on the x-axis and on the y-axis plot the increase in CO2 for the years 1981 to 2007. Shown in the thumbnail below is this plot: with black dots for the Southern Hemisphere (SH), red dots for the NH, and green dots for the tropics (redoing the analyses with global or sea surface temperatures instead of separating hemispheres produces nearly indistinguishable results). For example, in one year, the NH temperature anomaly was -0.6: this was followed in the next year by an increase of about 1.5 ppm of CO2 (this is the left-most plot on the figure).

The solid lines estimate the relationship between temperature and the change in CO2 (the dCO2/dt on the graph). These are loess lines and estimate the relationship between the two variables. If the loess lines were perfectly straight (and pointed in any direction), we would say the two measures are linearly correlated. The lines aren’t that straight, so the data does not appear to be that well correlated, linearly or otherwise.
Click on the figure (do this!) to see the same plot for each of the 12 months (right click on it and open it in a new window so you can follow the discussion). Notice anything? Generally, when temperature increases this year CO2 tends to increase in the following year. Hypothesis 2 is more likely to be true given this picture.
The loess lines are not always straight, which means that a straight-line model, i.e. ordinary correlation, is not always the best model. For example, in Januaries, until the temperatures anomalies get to 0 or above, temperature and change in CO2 have almost no relationship; after this point, the relationship becomes positive, i.e., increasing temperatures leads to increases in the change of CO2. The strength of the relationship also depends on the month: the first six months of the year show a strong signal, but the later six show a weakening in the relationship, regardless of where in the world we are.
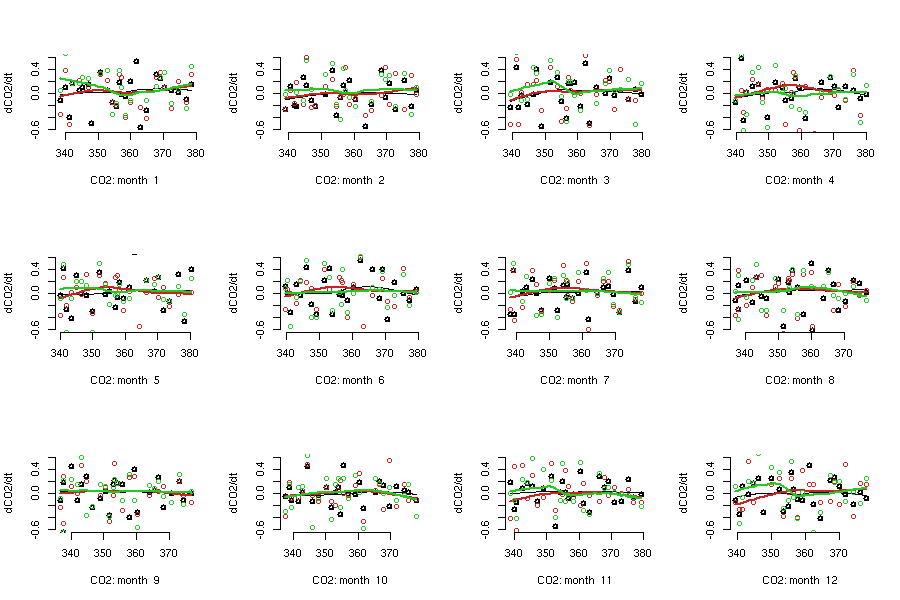
Coincidence? Now plot the actual December CO2 from 1980 to 2006 on the x-axis and on the y-axis plot the change (increase or decrease) in temperature for the years 1981 to 2007. For example, in one year, the NH CO2 was 340 ppm: this was followed in the next year by a temperature decrease of about -0.5 degrees (this is the bottom left-most plot on the figure). No real signal here:

Again, click on the figure (do this!) to see all twelve months. There does not appear to be any relationship in any month between CO2 and change in temperature, which weakens our belief in Hypothesis 1.
It may be that it takes two years for a change in CO2 or temperature to force a change in the other. Click here for the two-year lag between temperature and change in CO2; and here for the two-year lag between CO2 and change in temperature. No signals are apparent in either scenario.
As mentioned above, what we did not check are all the other possibilities: CO2 might lead or lag temperature by 9.27, or 18.4 months, for example; or, what is more likely, the two variables might describe a non-linear dynamic relationship with each other. All I am confident of saying is, conditional on this data and its limitations etc., that Hypothesis 2 is more probable than Hypothesis 1, but I won’t say how much more probable.
It is also true that, over this period of time and using this data, CO2 always increased. The cause of this increase sometimes was related to temperature increases (rising temperatures led to more CO2 being released) and sometimes not. We cannot say, using only this data, why else CO2 increased, although we know from other sources that CO2 obviously increased because of human-cased activities.
Discover more from William M. Briggs
Subscribe to get the latest posts sent to your email.
It may be useful to do an official analysis onCO2 Vs temp using the Vostok Ice core data. There you have ~400Kyrs of data.
You might try cherry picking like Tamino:
http://www.climateaudit.org/phpBB3/viewtopic.php?f=3&t=253
Pingback: Global Warming » CO2 and Temperature: which predicts which?
It has been shown hat CO2 has an 800 to 1000 year lag, following temperature increases. If CO2 is at an unusualhigh right now, we should look800 to 1000 yearsago. What do we find? the MWP. This was a wrldwide warming period as has also been shown, contrary towhat some have tried to suggest.. The important question is how important is .3 degrees of average global temperature over twenty years in a system that is billions of years old!
Theoretically it makes sense to increase the period covered – but not if it significantly increases the error in measuring one or both of the variables in question. My assumption is that Matt has focused on the satellite record because he considers it less problematic than the SST and ground records – not mention to problems with CO2 measures in ice cores.
I am also not clear as to what physical mechanism is responsible for an 800 to 1000 year lag – even if statistical such a relationship is significant. With the shorter lags we can at least hypothesize a number of physical processes that produce these lags.
I wonder about the 800+/- year lag between T and CO2 in Vostok ice cores.
Think a moment about the processes that contribute to the formation of glacial ice.
Snow falls and is buried by later snow. After many years (how many?), compression from subsequent snow accumulation creates ice.
During the time between the snow falling and ice forming, the air within the snow interacts with atmosphere. How does this affect the CO2 content of trapped air bubbles?
Another problem with ice bubbles is that gas can still diffuse through ice and between crystal boundaries. How does this affect CO2 content?
And what about bacteria in the ice? How does bacterial metabolization of CO2 affect its content in ice?
Finally when deep ice cores are brought to the surface, decompression causes fracturing within the ice crystals of the core. Does this process affect CO2?
These are not new questions, but they seem to be frequently ignored by too many on both sides of the CO2 debate. Altogether too much weight is applied to ice core CO2 without fully evaluating sources of error.
Bob,
I wouldn’t necessarily want to use the Vostok data because I don’t know how to account for the measurement error, which is of two kinds: (1) the error in the reconstructed values themselves, which is not important as (2) the error in the time of the reconstructed values. Nobody should say with certainty that a certain ice bubble is exactly, say, 12,242 years old.
This makes it nearly impossible to reliably correlate the two series in such a way that you can estimate the uncertainty of your guess.
Briggs
Ice core proxies and other proxies combined with GCMs are very poor substitutes for experiments. Climate science will remain a second rate science until it learns to do real world experiments to verify and falsify hypotheses.
You might say the same criticism applies to geology and evolutionary biology. Except that no one is trying to completely overturn the world economy based upon geology and evolutionary biology.
you also may perform a multivariate analysis
http://home.casema.nl/errenwijlens/co2/dc2002fig2.gif
Douglass, D.H. and B.D Clader, 2002, Climate sensitivity of the earth to solar irradiance, Geophys. Res Lett. vol 29, no. 16, 10.1029/2002GL015345
Matt:
I for one find this line of analysis elegant and interesting – even if for only the last 28 years. I have not checked Hans’ reference – but surely someone has had a rigorous go at this before – if not quite as elegantly simple. If they haven’t then I am even more skeptical as to merits of any predictions associated with the supposed link between CO2 and temperature. It looks like castles built on sand.
Pingback: CO2 and Temperature: Which Predicts Which? - The Global Warming Skeptics Forum
Theoritically, the lag between increased CO2 and increased temperature should only be a matter of 24 hours to 48 hours.
CO2’s effect is derived through the em radiation spectrum and exchange of photons which operate at the speed of light.
Perhaps it takes more than 24 hours (day and night) for an increase in CO2 to capture more IR photons from earth re-radiation which then spread further energy throughout the rest of the molecules in the atmosphere.
Perhaps it takes a further 24 hours for all the extra photons captured the day before (at the speed of light) to fully spread throughout the atmosphere.
The only lag longer than 48 hours would be if the oceans are absorbing some of that increased temperature and storing it deep in the ocean where it cannot exchange with the upper layers of the ocean and the atmosphere. Of course, two mediums in contact with each other will seek to stabilize temperatures amongst each other so it is very difficult to see how the oceans could absorb and store away the increased em energy.
The age of the CO2 in the ice can be determined by isotopic analysis, as far as I understand. The error bars on this measurement are considerably smaller than 800-1000 years. The physical mechanism for the large time lag is clearly not likely to be related to human activity. The oceans have enormous thermal inertia, taking 100’s of years to warm, unlike the land and air temperature. It makes sense that larger amplitude changes in CO2 emitted by the oceans would take a similar time scale.
I wonder what the global temperature line looks like if you separate it out – I mean taking all of the Dec. temps from the last 30 years and making a line from that.
I’m not suggesting any conclusions – just that it would be interesting to look at.
The method is sheer genius. No fancy time series filters, no ARIMA, no lag frequency analysis, just pure comparison of data sets with trellised scatterplots. Kudos. This is what statisticians should be doing. Simple, exquisite, logical, with excellent visual display of quantitative information. Carefully stated conclusions, properly qualified. Bill Cleveland would be proud. Kudos again. My favorite blog.
Matt:
Aren’t our calendar months kind of arbitrary units to be incorporated into a model like this? What if you looked at the data not in terms of months but blocks of days on and around the solstice – assuming that the data was available and tractable. Then we would be in essence controlling for the relative position of the sun and the earth?
Bernie,
You’re right, you could do something like that and improve things a bit. The months aren’t too bad, however, since the solstices (solstii?) are around the 21st-ish of the months. So we’re not too far off.
You caught me – I didn’t know how to spell the plural!! Apparently it is solstices.
The difference probably is not worth the effort – but it is interesting how much they do wander:
http://en.wikipedia.org/wiki/Solstice
A very interesting approach, mr Briggs.
Unfortunately though, you arrive nowhere. And it is clear why you fail to do so, for the weather noise is clearly on a higher order of magnitude than year-on-year temperature changes because of CO2 change (or any other “big background reason” you pick, like sun activity and the likes). If the weather is chaotic year on year, we could still have a much quieter and smooth decade on decade growth because of CO2. I don’t understand much of statistics, but it seems to me that to try and correlate something without taking out the noise of year-on-year, results in what we see here, which is nothing relevant. Some years, you’ll get warmer temps, others you’ll get colder temps, but always rising CO2. How could you get any correlation on this kind of analysis?
Worse, for I believe you are an intelligent person, I suspect that you know this already and are just making a straw-man attack and hope no one will notice it, in order to “sing to the chorus croud”. For me to point it out, I’ll be called a “denier” of the “denier’s truth”. As if I could care less at that.
I’m all for independent thinkers. But I’m also for rigorous thinking, not this. Hope you develop it further, so these kind of concerns are resolved.
Luis:
Matt is using exactly the same measurement units as Hansen and many other strong AGW proponents- he is organizing them in a visually different way. He is looking at a 30 year record as do many who focus on the satellite record. I do not understand your points – except the one that you do not understand much of statistics. To establish causality you have to use some form of temporal sequencing. Which one do you suggest? What straw man is being constructed here? The point at issue is whether the existing data allows one to see dT ==> dCO2 or dCO2 ==> dT – recognizing that positive and negative feedback loops undoubtedly exist. Do you see this as an illegitimate question? If so, why?
So where exactly is the link then Louis? The abovegraphs demonstrate that there is clearly no causal link between the two. CO2 has not yet been demonstrated to be a driver of climate. Show us your graph that shows it does. The CO2 graph from ML in Hawaii is indeed depicted as Mr Briggs shows. In fact the recent numbers for this spring from Hawaii show a drop in the normal trend for this time of year, whichas mentioned is expected to be higher. The observations do not fit the models. FACT. Research grade tools are being used for weapons grade propaganda. Those forging the tools should i time b held accountable. The last part is the fantasy!
Luis,
For once, I completely agree with you, re: your assessment of your statistical knowledge.
Actually, though, your criticisms don’t make any sense, physically or statistically. They are just too vague to be of use. Could you have a go at forming a specific problem (other than the ones I noted in my write up)?
Briggs
Luis:
Just to be clear – the above in no way confirms your prediction that ” I?ll be called a ?denier? of the ?denier?s truth?. ” The last three posters are simply pointing out that your comment is extremely unclear – there is no basis for calling you anything since it is hard to tell what you are saying.
Matt:
What happens if you switch from the satellite record to the surface records, extending the time periods accordingly. Does the general conclusion hold? Or is there a more specific reason for believing that the surface records are so deeply flawed so as to compromise the approach illustrated here? I can see a number of different temperature sub-sets being run – but now we would be on a fishing expedition.
Well, I’m sorry for not being clear and yes, I don’t know much about statistics. I am sure that my suspition that Mr Briggs is trying to attempt a Straw man was regarded as aggressive. It’s not, it’s just what it made me felt, precisely because I don’t know much about statistics and the error in the analysis seems glaring to me. I can be wrong, so please explain me. What I try to convey is:
1. If CO2 is the main driving force of every temperature variation, then all of your analysis should show it.
2. Not every temperature variation is due to CO2, as even the IPCC report aknowledges. Sun activity, El Nino, El Nina, cloud coverage, and a lot of chaos built upon it is added unto question. To claim otherwise would be to say that the weather analysis is equal to the climate analysis, which is known to be false.
3. As a previous post that I’ve seen here states, if you have multiple functions rendering a graph, just like CO2 + “Others”, then all those functions, including CO2, could be, theoretically, anything we want. Likewise, the reverse is true. Even if you have a causality that says more CO2 equals more temperature, it would probably not show in year-on-year analysis because of all of the “other” functions.
4. What it seems to me, but I know little as I said, is that you’re trying to prove a negative. Good luck with that.
5. In the other hand, when we see the graph of CO2 and the temperature graph of the last 30+ years, there is a correlation. Even if we take for granted that since 98 temps have stagnated, they have done so in a higher plateau than in the 90’s.
6. If we take noise of temperature, and by noise I mean the function of “Others”, which we take for granted that it is somehow “chaotically stable” in the long run and not “out of control”, as CO2 seems to be, but if we take noise and make a chaotic function out of it, as stable as a sine function, but umpredictable in the short run, added to a a x b + c function.
a) How would this scenario cause different results than yours? Namely, how would it fare on year-on-year analysis on causality?
b) How would this scenario not mean that average temperatures will rise?
c) How is “average” not a good indicator of a long trend in this case?
If the answers to my questions are as I suspect, then the straw man criticism of mine stands. Or does it not?
In other words Louis, the correlation is a very lpoor fit” and getting loser with the fullness of time. Like Dorothy said if you can’t find it then it probbly wasn’t there in the first place. Mr Briggs takes a methodical look at the data, and will no doubt go over old ground for some people!. It is a necessary process if IPCC claims are to be falsified in the absence of IPCC statistical methodology. For the supposed causal link between CO2 and Temp it should be clearly demonstable. So far this has not been the case.
Luis:
I think you fundamentally misunderstand what is being done. You say: “Even if you have a causality that says more CO2 equals more temperature, it would probably not show in year-on-year analysis because of all of the ?other? functions.”
The analysis being conducted is over a 27 year period. One can adjust the analysis for different lags – though it is true that Matt has not explored extended lags here basically because there is no physical reason IKO why long lags are justified. The question is not whether CO2 and T are correlated per se, but can we determine which causes which by carefully looking at the pattern of correlations. Namely, if you lag the dT by a year is the correlation significantly larger or smaller than the unlagged dT with dCO2 . Everybody acknowledges that there are other factors influencing dT, BUT there is a strong hypothesis that dCO2 measurably and moreorless directly impacts dT thereby legitimating the basic model.
A much stronger argument to make about this analysis is the size of the net positive feedback loop – and Matt acknowledges this. I would think that the larger the feedback effect the less material is the original trigger mechanism. It amounts to a “does it make a differnece” type of question. At root of all this is the need for a validated model of the actual relationship between dCO2 and dT or, more precisely, dJ or change in atmospheric energy.
Others may have a more informed viewpoint than I.
Matt
You mentioned CO2/T studies. Can you provide links to any of the more comprehensive ones?
Luis,
Statistics is all about “proving a negative” as you call it. There is no such thing as proving a hypothesis, there is only the rejection of it (proving a negative) and the failure to reject (not necessarily false).
Now you need to understand that if a hypothesis rejects, it is wrong. Not kinda wrong, but wrong.
If it fails to reject, it’s more likely to be right, and yet it still could be wrong. It’s vacuous.
Roy spencer and Richard Lindzen have both shown in separate studies that there is to be found a negative feedback due to clouds rather than a positive one. The “strong argument” for a positive one is one which exists for proponents of a runaway greenhouse effect. Outside of statistics this shuld seem improbable in principle bearing in mind the age of our planet. Still the strength of the argument is in the politics not the maths.
Joy:
A clear positive feedback loop will exist if CO2 is a GHG – and I have not heard anyone say that it is not. In dispute is the size of the effect and the nature of the net effect. Whether the net feedback is positive or negative depends on the relative size and stability of all the various feedback effects. The analysis here I guess gives us some clue as to the magnitude of those effects – excluding possible tipping point effects.
Well, I am sad that my doubts have not been addressed. I thanks for the repplies, and I understand what you said, but my final question wasn’t answered. Therefore, I remain quite in doubt of your doubt!
Excluding possible tipping points? I take it you mean the runnaway greenhouse? The argument is that there is a limmit to what CO2 can do. IE if you added all the CO2in the world its affect would not be directly preportional to the ammount that was added. Do you subscribe to this? For herein seems to be where the two ideas diverge. Real world observations would seem to confirm this. However I realise the task here is to prove cause and effect.
I frankly don’t know about runaway temperatures based on GHG. Ultimately there may well be some dimishing effect but we do not know the shape of the curve. I am not sure about the real world observations. If such existed we would have a more precise model of dCO2 and dT interactions.
On a conceptual level, I have a strong logical aversion to the precautionary principle and any theoretical “tipping point” rhetoric – although as an individual I am very much risk averse wrt to financial decisions. It is not that tipping points don’t exist but in terms of human time scales they must be few and far between or we would would see far more frequent dramatic swings in physical, biological and social phenomena. It is also a very indiscriminate construct and can be applied to almost any change if you really insist.
All,
Just a quick technical note: in modern statistics, you cannot prove any hypothesis, you can only say whether it is more or less likely.
Even in classical statistics, you could not prove a hypothesis was false, and it was forbidden to say how likely any hypothesis was.
And so the discussion descends into nonsense. The truth is that we don’t know whethr the world will end tomorow, but we would all put money on a bet that it won’t. So to sit on the fence when asked about the concept of a runawaygreenhouse affect is similar to saying that you don’t know if the sun will rise tomorrow. This is not helpful. Why do you need a curve to know the answer? Is it man’s love of “curves” that drives this? I joke of course, but my point is equally valid. Iheard an expert on Bloomberg saythe other day “it depends on the shape of the curve”. This is a get out of jail free card and it made me chuckle. I think I’ll try using it on my patients.
Just in case it wasn’t cler I am arguing on logical grounds. I do not see impending doom in the information that I have gathered over the last six months. Sorry if myargument is logical and not statistically pure. There are many dimentions to this argument and those crunching numbers should always remember this. There is abigger picture to be considered. Otherwise Ifear you may go down the slippery road of virtual sciencewhich does not represent the real world which is analogue not digital. I’ve had enough now, off to tell my patient thatwe cannot be sure of anything for his bone may not heal and it cannot be proved one way or the other. …maybe not, I’ll give my opinion instead, based on fifteen years experience and medical textbooks.
Here’s me sitting on my hands!
Luis,
You just proved the existence of god. Only a totally benevolent being totally powerful being would create a world in which someone as ignorant as you could have a chance for survival.
Joy:
I think you are being too harsh. When I say I am not sure, it generally means that I am not sure. It may be on logical, empirical or theoretical grounds. The problem is akin to how Matt set up this thread: he has two hypotheses and even they may not be mutually exclusive. The job is to figure out which one is morelikely to be right. I appreciate your 15 years experience and its value to making calls, but there is no need for a hurried judgment call here. We can do the “test” to clarify our understanding.
By the way, I am confused as to whether you are saying there is or there is not a runaway GHG effect. If you think there is, then I can understand your sense of urgency. If you think there is not, I am not sure as to the basis for your sense of urgency.
Confused?… I thought it was very clear. The runaway greenhouse effect is something that exists within the computer models or GCM’s that do not account for real lworld negative feedback and with the fact that the CO2 radiative effect reduces with every doubling. My irritation is with those who seem to fain uncertainty on statistical grounds when logic and common sense should be telling you the answer. It was not intended to come across as harsh! It is exactly this “fluffy” uncertainty that has allowed the IPCC to get away with their chinese whisper science. IfI return to my patients again, if I tell someone that there is no good reason why their bone won’t heal they go away happy and reassured. If I say I cannot say with complete certainty that this bone willl heal, they won’t sleep for weeks and their pain will be worse. So my frustration is how the statistics are used to magnify uncertainty (in Bernie’s case to make an accademic point.) In the case of the bone the latter advice is the more scientific, but the first is the most pragmatic. I have no argument with Mr Briggs stats, far from it. I have said my bit and hope it makes sense to some. No offence was intended Bernie.
Mr Briggsor Bernie or anyone: is there such a thing as statisticly significant certainty or is this the same as statistical significance? Sorry if this sounds funny but it’s a sincere question.
Joy: No offense taken at all. Perhaps here is where I was getting confused. To me “runaway” can mean either a very strong net positve feedback loop (as in catastrophic warming scenarios) or a slightly net positive feedback loop. Both are exponential growth curves, the former is much steeper than the latter. Which one, if either, holds is an important question.
I am not feigning uncertaintly on statistical grounds but rather I simply do not know how to size these effects. As I said earlier, my instinct tells me that, if any, the net positive feedback loop will be small – but my instincts also told me the Patriots would win the SuperBowl. The reality is I do not know the size of the net positive feedback effects of dCO2 and it is not clear to me that anybody else does either. But then I am an amateur at all this.
Joy,
The term “statistical significance” belongs to the classical theory. It meant that a p-value was “low”, usually less than 0.05. It meant nothing more than this. It did not mean, for example, that the results are useful or interesting or relevant.
There is no point in putting the words “statistically significant” before “certainty”, as they are, in the probabilistic sense, superfluous. In the modern way of looking at statistics, you simply quantify the uncertainty, using probability, of statements (also called hypotheses). In classical statistics, it was forbidden to attach probability measures to the true of hypotheses.
Hope that helps.
(P.S., if we can ask, where are you a doc?)
Briggs
Thank you very much for clearing this up I thought it sounded clumsy. I suppose modern statistics can mislead. Reading some threads on the subject statistical arguments seem to go in circles. modern statistics allows for more uncertainty. In fact now I’m not even certain of that!
I am a physiotherapist.
Briggs, I must say, I wish I’d had a prof who taught your way when I learned stats. Ours was more geared towards engineering, so if it was close enough, it was true (so to speak).
My biggest falling out with stats was when we studied chaos and complexity theory. It seemed to me that causality went out the door and probability based decision making was very very short-term stuff (for time scaled decisions).
Is this the case? Or should I start sending my old profs some nasty letters…..
I must reaffirm my doubts. Like I said, I read Bernie’s detailed answer, but it didn’t address my real issues with the method. The key thing is that while you can find some correlation, the chaotic nature of year-on-year temperature due to other factors will spread the dots all over the graphs, hiding the correlation.
My question boils down to this:
If you Plot a graph that has two functions:
a) f(x) = a * b + c
b) f(z) = chaotic random
such as f(z) has slightly more amplitude than f(x), then:
Will you be able to spot f(x) in your methodology or not?
Think of it like a control test. The fact that you didn’t find any causation does not prove anything, unless you can prove that causation is always (or mostly often) spottable.
@steven mosher
Still much bruised after the other debate? Go put some ice on it.
Luis:
I am not sure I quite get what you mean by amplitude, but if what you are arguing is that there is a barely noticeable relationship between dCO2 and dT and there ia a host of factors impacting T then the dCO2 and dT relationship will be hard to find – then I couldn’t agree more! But then the enitre AGW issue appears to be somewhat overblown.
Dear, dear, dear, people! A mountain is being made out of a molehill here! A very clever and elegant molehill, to be sure, but nothing more!
Two data sets were compared using mostly visual techniques. Both data sets are highly imperfect representations of the real world. Without writing a treatise about either one, the numbers are smoothed, averaged, and filtered point measurements of allegedly global phenomena. Every data point is filled with error and bias, which means more than simple uncertainty or “noise.”
The method used was an elegant and very modern way to “mine” data. The only mathematical treatment was the loess curves, which are linear regressions weighted by adjacency. No other frequentist distributions were assumed. No confidence intervals were calculated. No q-q plots or other statistical tests were done to measure goodness of fit or probabilities.
The exercise did not confirm or deny the hypotheses, which were broad and global and certainly not testable using these data sets alone, much less these visual displays.
What may be inferred is that the method is logical and simple. The method could be applied to many data sets of many kinds of phenomena, and relationships can be revealed using it. It is a clever and compelling way to examine data.
At best we could say that some weak evidence has been produced that casts some suspicion on the generally purported cause-and-effect nature of CO2 and global temperature change. In no way has that question been fully explored herein. But the method can be a powerful tool, given accurate and precise data sets.
I commiserate with those who seek certainty in an uncertain world. But you will not find the answers you seek in these data sets alone, or in philosophic dialog, or statistics, or in religion, or in atheistic science. The best I can offer you is this advice: prepare to be amazed, because we really don’t know what’s coming.
“I commiserate with those who seek certainty in an uncertain world.”
I have no problem whatsoever with uncertainty. I have problems though in knowing how valuable certain statistics really are. If this analysis has a 20% relevance, it is a good percentage. But if it has a 0.1%, it is pointless. Same could be said about GW. If such variables are not even known or suspected, then all the science of GW and even the science of the maths backing this post is meaningless and worth zero.
What may be inferred is that the method is logical and simple.
Yes, I saw that. It is quite beautiful too, but the question remains: is it solid? Does it work? Does it really spot all the causalities? And with how much certainty?
Because, answering Bernie, CO2 influence could in fact be minimal in 20 year lifespan, but in 100 years it could be deadly and relentlessly navigating north. That’s the crux of the debate.
Said that, I am no apologist of any theory in particular. I’m more scared with the impending ice age, which may come some thousands of years from now, or even as few as some hundreds, than I ever could about GW. But since it has so much political activity about it, I like to see it tested.
All,
Although probability models can be used to identify causality, the models here—well, strictly, there are no models here—do not do so. Here, some weak “correlations” are seen. Now, it is a logical fact that you can have correlation without causation (spurious signals), you cannot have causation without correlation. Certainly, as is well known, there is some external information available to speculate that there are causal relationships between CO2 and Temperature.
So the best we can say, using this data, that if Hypothesis 1—the most touted one—is true, it is odd that the actual data conforms better to Hypothesis 2. This statement is of course consistent with Hypothesis 1 being true and H2 being false, but it is also consistent with saying H2 is (slightly) more probable than H1.
Incidentally, loess curves were designed to uncover unknown f(x)’s, regardless of their exact form. You should, as I say in the original post differently, always view their estimates with a grain of salt. They are only meant to be semi-quantitative.
And here’s another fact, often forgotten: there are an infinite number of possible f(x)’s that could exist between these two sets (or any two sets) of data. To claim, therefore, which I do not, to have found the true f(x) is to make a bold statement. (Search for the post “Statistics? dirtiest secret” for more on this topic.)
What we can say, is it looks like linear correlation—the method I see most often used, in peer-reviewed studies and out of them—is almost certainly the wrong thing to do.
Briggs
Mike:
I take it that you agree with Matt(Briggs) then? The major point revealed by Briggs’ analysis is that any simple dCO2 ==> dT relationship is not evident in data sets where we might expect to see it. As with the earlier discussion on the existence of God, the onus of proof is on those who would have us believe something different than we already believe or are agnostic about.
“Search for the post ?Statistics? dirtiest secret? for more on this topic.”
I had read it prior you wrote this post, Mr Briggs. Thanks for your answer. So you say that this is a pretty good method to uncover even unknown f(x)s. Interesting. I wonder if it is possible for a comprehensive study of this kind to reasonably (in the order of 90% certainty) debunk the warming theory.
I also wonder if any statistician will boldly try to do it.
And no, I’m not trying to make you jump into it. It surely must be a complete miserable and boring of a job!
Have a nice day,
Luis
Matt
“What we can say, is it looks like linear correlation?the method I see most often used, in peer-reviewed studies and out of them?is almost certainly the wrong thing to do.
Briggs”
The reason I contacted you what seems so long ago regarding the trend of the RSS, UAH data.
It is fun to see the how other people have picked this up like Basil at Whattsupwiththat and Allan Mcrae etc .and have analysed the data in different ways.
Still reading your blog every day. Really enjoyable stuff!
Bernie,
I DO agree with Matt(Briggs) on all points. And I find that surprising, and refreshing, and am growing quite fond of Matt(Briggs) as a result. I feel bias and trust (certainty) toward his skill as a statistician and logician. He’s quite sharp, and I think he must be a wonderful teacher. But I don’t want him putting on any airs now because of it. My judgment is not always correct.
What I like the most about Matt(Briggs) has nothing do with CO2 or AGW. It is his dedication to and understanding of statistics, which I think of as the Church of Logical Inference. Mathematical epistemology: what do we really know, or more precisely, what is probably true and probably false. Even sub-Bayesian classicists like myself seek the truth, a most wily and elusive prey.
Mr. Briggs,
would you consider Granger causality as a tool for answering your question?
Please allow me to correct a statement I made above. I said the analysis in question provided “weak” evidence. More properly I should have said “suggestive” evidence that CO2 is not causally related to global temperature change. The analysis is one piece of accumulating suggestive evidence, however, including the fact that the last ten years have seen rising CO2 concentrations and static or falling global temps, according to the modeler claimants’ own data.
Regarding models of climate change: they are gross simplifications of a complex system. They are largely based on laws of chemistry and physics that may work well in laboratory settings under controlled conditions, but the Earth’s atmosphere is known to be an open system with large elements of chaos at play. Chaos theory itself was derived in part from cloud formation observations and theoretically intractable fluid dynamics.
The CO2 measurements from Mauna Loa, which seem to be so steady, are quite variable over short time periods; measurements can vary 50 to 100 ppm over 15 minute intervals. The collecting station is in the saddle between Mauna Loa and Mauna Kea which is also used as an artillery and tank training area by the U.S. Army. A highway traverses the saddle, providing a route between Hilo and Kona as well as access to the ever-expanding astronomical observatory complex on Mauna Kea. Much highway work has been done on the Saddle Road over the last 20 years. Despite a frequent inversion layer, the setting of the CO2 measurement station is not hermetically sealed from rest of the Island.
Global temperature is derived from point measurements, also averaged, at weather stations throughout the world. Anthony Watts has demonstrated that many of the U.S. stations suffer from urban heat island effects. Even without those effects, instantaneous measurements are averaged to yield diurnal data points. Some temp readings are based on daily highs and lows, which are again point measures that do not provide the actual heat-work that has gone on during any given day. The maxima and minima have been substituted for the area below the curve, the actual heat quantity. Even satellite data, which I assume comes in a continuous stream, cannot unravel the chaotic interplay between altitudes or ocean depths.
Such is the troubling nature of the data. The analysis above reveals suggestive evidence nonetheless than current in-vogue climate theories are defective in an important way. More troubling are the in-vogue political “solutions” to theories poorly supported by the empirical data. Using human history as our guide, we may logically infer that such solutions will have unintended consequences far more serious and detrimental than rising global temperatures due to CO2 emissions, if indeed the in-vogue climate theories are correct, which they don’t seem to be anyway.
Luis, I have no debate with you. i’m agnostic as i said. i pointed
you in the direction of plantinga, as i noted, in the hopes that
you would say something silly. you did not disappoint, as evidenced by your contention that we actually had a debate.
For the theists out there I provided a link to a thinker they might find helpful. Do I buy his arguments, no I’m agnostic. Do I buy Dawkins
no. His argument has logic holes you can drive a truck though.
Am I interested in the debate over god’s existence? no. I’m agnostic. Do I care if you disbelieve? no. Do I care that others believe? No. do you need evidence for everything you believe?
no. I believe you have a mind. Do I have evidence of this? no. Could I prove that you have a mind with certainty?
no. Could I be wrong about you having a mind? Yes.
Am I?
dumb question: I have not been able to find mauna loa like data from any center in the continental usa.
esrl/noaa co2 tracking is not reported except by satillite.
I would just like to know how c02 has varied in the middle of a kansas wheat field over the last 40 years and also from on top of the mepire state building or in Green mountain national forest.
does any one have such a data source?
Stephen:
So what is your take on dCO2 ==> dT or dT ==> dCO2 and Broggs’ exposition?
Bernie–
I don’t know about Steve’s take, but I think Briggs’s dCO2 ==> dT or dT ==> dCO2 exposition is thought provoking.
These sorts of things should be looked at. Certainty is not always required when reporting any conclusion. Thank heaven blogs people the ability to communicate ideas to others who might be interested.
re 58. bernie
C02 debates? I have sworn off c02 debates. They are the intellectual equivalent of strip clubs. The minor difficulty I have with Dr. Briggs approach is that it is un informed by physical understanding.
I dont mean that in a mean way. He is quite open that he makes no pretense of an underlying model. he is crunching numbers. And his approach is most elegant. Let me put it this way.
If you didnt know that the two time series Dr. Briggs analyzed were C02 and temp, would that change your opinion?
Hand a 100 graduate students in stats those two time series
dont tell them that one is C02 and one is Temp, and if they
are smart they will probably side with Dr. B. Take those same
two time series ad hand them to physics grad students working for
james hansen and tell them that they are C02 and temp and you’ll get an interesting physical theory and maybe some wacky stats to explain the data.
I like Briggs’ work because he brings nothing to the table.
rephrase that. brings no bias to the table, just to be clearer
No. The intellectual equivalent of strip clubs is blog discussions of chaos.
Lucia I noticed you stayed out of that fight over at RC even after I enticed you to join in. At some point I want to know the relevance of the difference of opinion betwixt gavin and RogerP.
As to C02. As a lukewarmer i think Increased C02 will warm the planet and a warmer ocean increases C02. Feedbacks and lags complicate the matter as you well know. I liked briggs approach because it taught me something. I see it as a tool.
and I see no point in getting into a fight about C02. You have
times series X, you have time series Y. How do you answer the question of what correlates with what? How do you answer that without preconceptions? Good problem.!
Briggs did I get that about right?
Lucia.
Check out William Connely today. he said that Cochrane orcutt
was a non standard method unheard of in climate science.!!
it’s fricking cook book method.
Google was not his friend. There is a book you might like by richard smith from unc. Enviromental statistics. In chapter
7 he looks at using C-O to analyze the temperature series.
he referred to C-0 as a classical method.
Some (late) comment here…
What I am missing is that one need quite different lags for different time frames.
For the long-term (Vostok based) influence of temperature on CO2 levels is about 8 ppmv/?C, with lags of 800 +/- 600 years during a ice age – interglacian transition and several thousands of years the other way out. The 8 ppmv/?C also holds for the past 1,000 years, until the start of the industrial revolution (Law Dome ice core data), with a lag of about 50 years.
Current short time influence of temperature on CO2 levels is about 3 ppmv/?C, not on CO2 levels, but modulating the CO2 increase speed, with a lag of about a month, while the bulk of the increase is caused by the emissions.
If you want a formula:
Catm(new) = Catm(old) + 0.55*CO2(emissions) + 3*dT
The concentration of CO2 in the atmosphere increases with about 55% of the accumulated emissions, modulated by temperature differences. These play a smaller role on longer term, as most levels out. For the past 50 years of CO2 data, the temperature influence is less than 2 ppmv for a 60 ppmv increase. The correlation between accumulated CO2 emissions and increase in the atmosphere is a near fit (R^2 over 0.99).
The other way out, the influence of temperature on CO2 is more difficult to know, as there is a (probably) very small signal within a lot of noise. Thus it will take much more time to know the real impact of CO2 temperature. From the far past (Vostok), we know that the influence is small, as a drop of 40 ppmv at the end of the Eemian (the last interglacial) had no measurable influence on temperature, within the measurement accuracy…
Ferdinand:
I didn’t understand this bit:
“These play a smaller role on longer term, as most levels out. For the past 50 years of CO2 data, the temperature influence is less than 2 ppmv for a 60 ppmv increase. ”
Are you putting a bound on the positive feedback loop from increase temperature on additional increases on CO2 from stored sources?
Bernie,
If we take the last about million years as base, there seems to be an upper limit for the influence of temperature on CO2 levels of about 8 ppmv/?C. That includes (very) long feedback times like changes in vegetation growth (including area limits), ice cover and (deep) ocean currents.
That doesn’t include very high temperatures and CO2 levels like we have had during the Cretaceous, but it includes the Eemian, about 120,000 years ago, when temperatures at high latitudes probably were 5?C higher (Alaska), and a (large) part of the Greenland ice sheet was melted.
The interesting part is that despite the highly non-linear reaction of a lot of biological and physico-chemical processes on temperature changes, the sum of al these reactions looks quite linear in the Vostok (and the Epica) ice cores… See here.
OK, but bottom line that sounds like you do not see a runaway GHG effect?
So what does this mean with respect to dCO2 ==> dT as opposed to dT ==> dCO2.
It appears that you are saying that the magnitude of the change in CO2 must be the primary driver, rather than any feedback mechanism inducing ever increasing amounts of CO2. If so, then no short term catastrophic warming>
The intellectual equivalents of strip clubs are strip clubs.
But what about strange attractors? Mandelbrot sets? What is the fractal dimension of clouds? Random is just another word for nothing left to lose; chaos has charisma.
And why Poisson?
Bernie,
The increase of CO2 as result of temperature changes indeed is far too small to induce a runaway reaction (the feedback factor is far less than 1).
Further, the largest feedback mechanism with increasing temperatures is ice/snow albedo, which played an important role during ice age – interglacial transitions (and reverse), far less today, as we are already in an interglacial. Thus increasing CO2 levels may have a (limited) influence on temperature, but I don’t see that it will introduce a runaway reaction…
We should have a look at the high-CO2/T periods like the Cretaceous to see what the CO2/T ratio was (still without a Venus-like runaway atmopshere), although the data from that period have wide error margins…
The link in #66 doesn’t work, here is the complete URL:
http://www.ferdinand-engelbeen.be/klimaat/correlation.html
It seems difficult to include working references to the net… The Vostok CO2/T covariance can be seen at:
http://www.ferdinand-engelbeen.be/klimaat/correlation.html
I’ve just caught up with this post, William. A lovely piece of empirical enquiry. Straightforward, simple and graphic. I had been asking myself (incoherently) these questions about the direction of causality for months. Your dissection of the data clarifies things (despite the limits, which you acknowledge, of the analysis). Thank you .
Peter
This is a quite late comment and I am not sure if William already has performed the following calculations.
How do the monthly (?ies) graphs look like when you compare them with land measurements for the same time 1979-2007?
I am curious.